最优分类阈值

分类问题中阈值的选择
python
machine learning
Author
Published

Saturday, May 11, 2024

这里我们借助scikit-learn来探讨分类问题中阈值的选择。

数据准备和参数选择

首先是数据准备:

import matplotlib.pyplot as plt
import numpy as np
import pandas as pd

from sklearn.datasets import load_breast_cancer
from sklearn.model_selection import train_test_split
from sklearn.metrics import confusion_matrix

np.set_printoptions(suppress=True, precision=8, linewidth=1000)
pd.options.mode.chained_assignment = None
pd.set_option('display.max_columns', None)
pd.set_option('display.width', None)

data = load_breast_cancer()
X = data["data"]
y = data["target"]

Xtrain, Xvalid, ytrain, yvalid = train_test_split(X, y, test_size=.20, random_state=516)

print(f"Xtrain.shape: {Xtrain.shape}")
print(f"Xvalid.shape: {Xvalid.shape}")
Xtrain.shape: (455, 30)
Xvalid.shape: (114, 30)

模型我们这里选择随机森林。超参的选择,基于GridSearchCV,这里也不赘述。有一个点需要说明,由于使用的是肿瘤数据集,在这种情况下,我们更关注的是recall,即尽量减少假阴性的情况。因而,我们在训练模型时,也是将recall作为评价指标。

from sklearn.ensemble import RandomForestClassifier
from sklearn.model_selection import GridSearchCV

param_grid = {
    "n_estimators": [100, 150, 250],
    "min_samples_leaf": [2, 3, 4],
    "ccp_alpha": [0, .1, .2, .3]
    }

mdl = GridSearchCV(
    RandomForestClassifier(random_state=516), 
    param_grid, 
    scoring="recall", 
    cv=5
    )

mdl.fit(Xtrain, ytrain)

print(f"best parameters: {mdl.best_params_}")
best parameters: {'ccp_alpha': 0, 'min_samples_leaf': 4, 'n_estimators': 100}

模型预测

拿到模型后,自然我们可以开始预测:

ypred = mdl.predict_proba(Xvalid)[:,1]
ypred
array([0.005     , 0.82743637, 0.97088095, 0.        , 0.        , 1.        , 0.98020202, 0.67380556, 0.        , 0.99333333, 0.9975    , 0.30048576, 0.9528113 , 0.99666667, 0.04102381, 0.99444444, 1.        , 0.828226  , 0.        , 0.        , 0.97916667, 1.        , 0.99607143, 0.90425163, 0.        , 0.02844156, 0.99333333, 0.98183333, 0.9975    , 0.08869769, 0.97369841, 0.        , 1.        , 0.71100866, 0.96022727, 0.        , 0.71200885, 0.06103175, 0.005     , 0.99490476, 0.1644127 , 0.        , 0.23646934, 1.        , 0.57680164, 0.64901715, 0.9975    , 0.61790818, 0.95509668, 0.99383333, 0.04570455, 0.97575758, 1.        , 0.47115815, 0.92422619, 0.77371415, 0.        , 1.        , 0.26198657, 0.        , 0.28206638, 0.95216162, 0.98761905, 0.99464286, 0.98704762, 0.85579351, 0.10036905, 0.00222222, 0.98011905, 0.99857143, 0.92285967, 0.95180556, 0.97546947, 0.84433189, 0.005     , 0.99833333, 0.83616339, 1.        , 0.9955    , 1.        , 0.99833333, 1.        ,
       0.86399315, 0.9807381 , 0.        , 0.99833333, 0.9975    , 0.        , 0.98733333, 0.96822727, 0.23980827, 0.7914127 , 0.        , 0.98133333, 1.        , 1.        , 0.89251019, 0.9498226 , 0.18943254, 0.83494391, 0.9975    , 1.        , 0.77079113, 0.99722222, 0.30208297, 1.        , 0.92111977, 0.99428571, 0.91936508, 0.47118074, 0.98467172, 0.006     , 0.05750305, 0.96954978])
这个时候,我们要讲的东西就来了。一般地,我们会选择0.50作为分类阈值,即大于0.50的为正类,小于0.50的为负类。

ypred = mdl.predict_proba(Xvalid)[:,1].reshape(-1, 1)
yhat = mdl.predict(Xvalid).reshape(-1, 1)
preds = np.concatenate([ypred, yhat], axis=1)
print(preds)
print(confusion_matrix(yvalid, yhat))
[[0.005      0.        ]
 [0.82743637 1.        ]
 [0.97088095 1.        ]
 [0.         0.        ]
 [0.         0.        ]
 [1.         1.        ]
 [0.98020202 1.        ]
 [0.67380556 1.        ]
 [0.         0.        ]
 [0.99333333 1.        ]
 [0.9975     1.        ]
 [0.30048576 0.        ]
 [0.9528113  1.        ]
 [0.99666667 1.        ]
 [0.04102381 0.        ]
 [0.99444444 1.        ]
 [1.         1.        ]
 [0.828226   1.        ]
 [0.         0.        ]
 [0.         0.        ]
 [0.97916667 1.        ]
 [1.         1.        ]
 [0.99607143 1.        ]
 [0.90425163 1.        ]
 [0.         0.        ]
 [0.02844156 0.        ]
 [0.99333333 1.        ]
 [0.98183333 1.        ]
 [0.9975     1.        ]
 [0.08869769 0.        ]
 [0.97369841 1.        ]
 [0.         0.        ]
 [1.         1.        ]
 [0.71100866 1.        ]
 [0.96022727 1.        ]
 [0.         0.        ]
 [0.71200885 1.        ]
 [0.06103175 0.        ]
 [0.005      0.        ]
 [0.99490476 1.        ]
 [0.1644127  0.        ]
 [0.         0.        ]
 [0.23646934 0.        ]
 [1.         1.        ]
 [0.57680164 1.        ]
 [0.64901715 1.        ]
 [0.9975     1.        ]
 [0.61790818 1.        ]
 [0.95509668 1.        ]
 [0.99383333 1.        ]
 [0.04570455 0.        ]
 [0.97575758 1.        ]
 [1.         1.        ]
 [0.47115815 0.        ]
 [0.92422619 1.        ]
 [0.77371415 1.        ]
 [0.         0.        ]
 [1.         1.        ]
 [0.26198657 0.        ]
 [0.         0.        ]
 [0.28206638 0.        ]
 [0.95216162 1.        ]
 [0.98761905 1.        ]
 [0.99464286 1.        ]
 [0.98704762 1.        ]
 [0.85579351 1.        ]
 [0.10036905 0.        ]
 [0.00222222 0.        ]
 [0.98011905 1.        ]
 [0.99857143 1.        ]
 [0.92285967 1.        ]
 [0.95180556 1.        ]
 [0.97546947 1.        ]
 [0.84433189 1.        ]
 [0.005      0.        ]
 [0.99833333 1.        ]
 [0.83616339 1.        ]
 [1.         1.        ]
 [0.9955     1.        ]
 [1.         1.        ]
 [0.99833333 1.        ]
 [1.         1.        ]
 [0.86399315 1.        ]
 [0.9807381  1.        ]
 [0.         0.        ]
 [0.99833333 1.        ]
 [0.9975     1.        ]
 [0.         0.        ]
 [0.98733333 1.        ]
 [0.96822727 1.        ]
 [0.23980827 0.        ]
 [0.7914127  1.        ]
 [0.         0.        ]
 [0.98133333 1.        ]
 [1.         1.        ]
 [1.         1.        ]
 [0.89251019 1.        ]
 [0.9498226  1.        ]
 [0.18943254 0.        ]
 [0.83494391 1.        ]
 [0.9975     1.        ]
 [1.         1.        ]
 [0.77079113 1.        ]
 [0.99722222 1.        ]
 [0.30208297 0.        ]
 [1.         1.        ]
 [0.92111977 1.        ]
 [0.99428571 1.        ]
 [0.91936508 1.        ]
 [0.47118074 0.        ]
 [0.98467172 1.        ]
 [0.006      0.        ]
 [0.05750305 0.        ]
 [0.96954978 1.        ]]
[[35  3]
 [ 1 75]]

但是,这个阈值是可以调整的。我们可以通过调整阈值来达到不同的目的。比如,我们可以通过调整阈值来减少假阴性的情况,这在类别不平衡时尤为重要。

阈值的选择

我们介绍几种常用的方法。

1. 阳性类别prevalance

我们看下这个数据集中阳性类别的比例:

print(f"Proportion of positives in training set: {ytrain.sum() / ytrain.shape[0]:.2f}")
Proportion of positives in training set: 0.62

这个toy数据集很夸张哈,达到了0.62。在实际应用中,这个比例可能只有10%或者1%。这里我们只是拿它示例哈,用这个prevalance来作为阈值。

thresh = 1- ytrain.sum() / ytrain.shape[0]
yhat = np.where(ypred <= thresh, 0, 1)
print(confusion_matrix(yvalid, yhat))
[[34  4]
 [ 0 76]]

考虑prevalance的方法,可以在类别不平衡的情况下,减少假阴性的情况。

2. 最优F1指数

F1指数是precision和recall的调和平均数。我们可以通过最大F1指数来选择最优的阈值。

Threshold using optimal f1-score: 0.471.

F1最高为0.471,我们采用它来进行预测:

thresh = .471
yhat = np.where(ypred <= thresh, 0, 1)
print(confusion_matrix(yvalid, yhat))
[[34  4]
 [ 0 76]]

3. ROC曲线

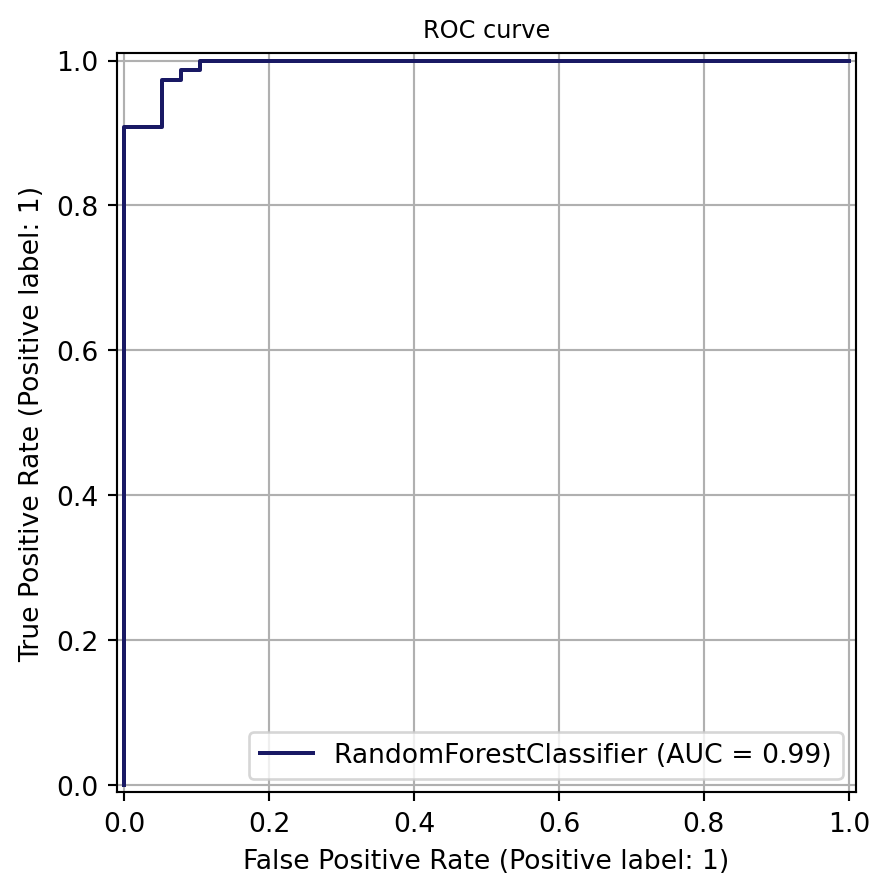
我们可以通过ROC曲线来选择最优的阈值。ROC曲线下的面积AUC越大,说明模型越好。我们可以选择ROC曲线最靠近左上角的点作为最优阈值。

4. PRC曲线

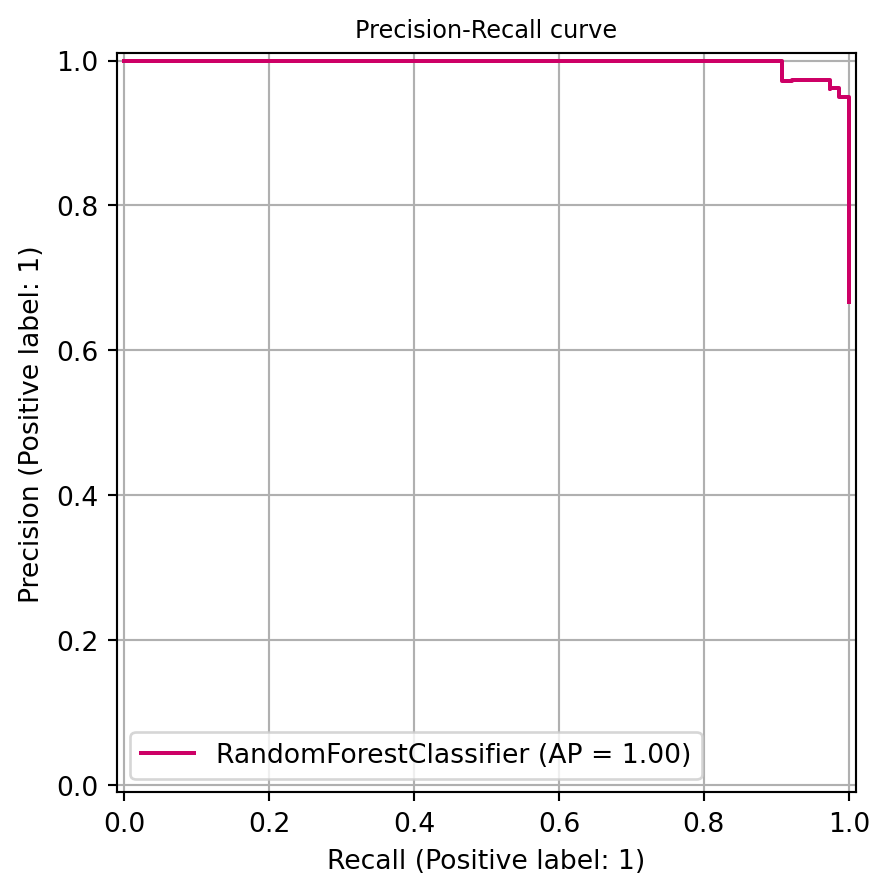
PRC曲线是precision-recall曲线。相比于ROC曲线,PRC曲线更适合类别不平衡的情况。我们主要选择PRC曲线最靠近右上角的点作为最优阈值。

Selected threshold using precision-recall curve: 0.674.

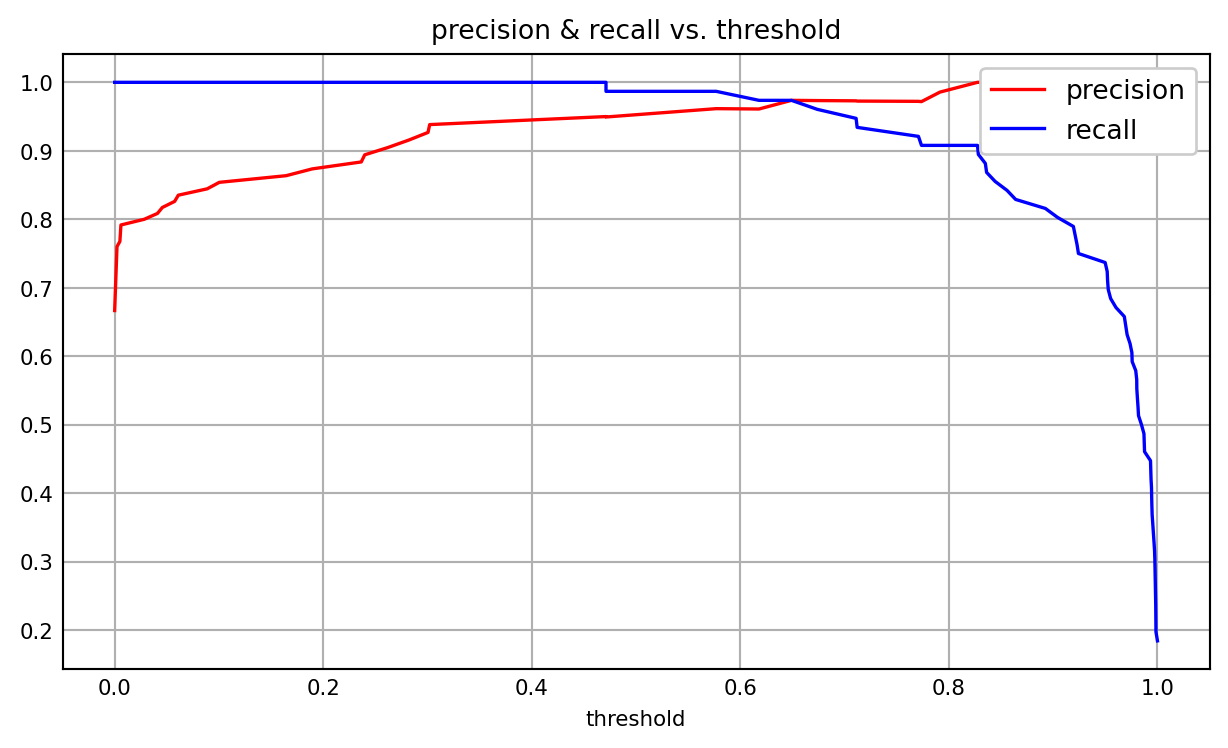
5. 分别关注precision和recall

我们可以通过调整阈值来分别关注precision和recall。比如,我们可以通过调整阈值来提高recall,减少假阴性的情况。


代码已经放进了星球里。